Fujitsu’s RX300 S5 rack server takes the top spot in VMware’s VMmark for 8-core systems today with a score of 25.16@17 tiles. Loaded with two of Intel’s top-bin 3.33GHz, 130W Nehalem-EP processors (W5590, turbo to 3.6GHz per core) and 96GB of DDR3-1333 R-ECC memory, the RX300 bested the former champ – the HP ProLiant BL490c G6 blade – by only about 2.5%.
With 17 tiles and 102 virtual machines on a single 2U box, the RX300 S5 demonstrates precisely how well vSphere scales on today’s x86 commodity platforms. It also appears to demonstrate both the value and the limits of Intel’s “turbo mode” in its top-bin Nehalem-EP processors – especially in the virtualization use case – we’ll get to that later. In any case, the resulting equation is:
More * (Threads + Memory + I/O) = Dense Virtualization
We could have added “higher execution rates” to that equation, however, virtualization is a scale-out applications where threads, memory pool and I/O capabilities dominate the capacity equation – not clock speed. Adding 50% more clock provides less virtualization gains than adding 50% more cores, and reducing memory and context latency likewise provides better gains that simply upping the clock speed. That’s why a dual quad-core Nehalem 2.6GHz processor will crush a quad dual-core 3.5GHz (ill-fated) Tulsa.
Speaking of Tulsa, unlike Tulsa’s rather anaemic first-generation hyper-threading, Intel’s improved SMT in Nehalem “virtually” adds more core “power” to the Xeon by contributing up to 100% more thread capacity. This is demonstrated by Nehalem-EP’s 2 tiles per core contributions to VMmark where AMD’s Istanbul quad-core provides only 1 tile per core. But exactly what is a VMmark tile and how does core versus thread play into the result?
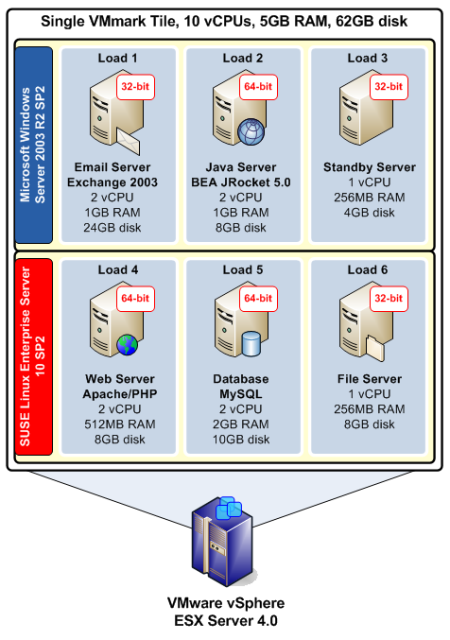
As you can see, a “VMmark Tile” – or just “tile” for short – is composed of 6 virtual machines, half running Windows, half running SUSE Linux. Likewise, half of the tiles are running in 64-bit mode while the other half runs in 32-bit mode. As a whole, the tile is composed of 10 virtual CPUs, 5GB of RAM and 62GB of storage. Looking at how the parts contribute to the whole, the tile is relatively balanced:
| Operating System / Mode | 32-bit | 64-bit | Memory | vCPU | Disk |
| Windows Server 2003 R2 | 67% | 33% | 45% | 50% | 58% |
| SUSE Linux Enterprise Server 10 SP2 | 33% | 67% | 55% | 50% | 42% |
| 32-bit | 50% | N/A | 30% | 40% | 58% |
| 64-bit | N/A | 50% | 70% | 60% | 42% |
If we stop here and accept that today’s best x86 processors from AMD and Intel are capable of providing 1 tile for each thread, we can look at the thread count and calculate the number of tiles and resulting memory requirement. While that sounds like a good “rule of thumb” approach, it ignores specific use case scenarios where synthetic threads (like HT and SMT) do not scale linearly like core threads do where SMT accounts for only about 12% gains over single-threaded core, clock-for-clock. For this reason, processors from AMD and Intel in 2010 will feature more cores – 12 for AMD and 8 for Intel in their Magny-Cours and Nehalem-EX (aka “Beckton”), respectively.
Learning from the Master
If we want to gather some information about a specific field, we consult an expert, right? Judging from the results, Fujitsu’s latest dual-processor entry has definitely earned the title ‘Master of VMmark” in 2P systems – at least for now. So instead of the usual VMmark $/VM analysis (which are well established for recent VMmark entries), let’s look at the solution profile and try to glean some nuggets to take back to our data centers.
It’s Not About Raw Speed
First, we’ve noted that the processor used is not Intel’s standard “rack server” fare, but the more workstation oriented W-series Nehalem at 130W TDP. With “turbo mode” active, this CPU is capable of driving the 3.33GHz core – on a per-core basis – up to 3.6GHz. Since we’re seeing only a 2.5% improvement in overall score versus the ProLiant blade at 2.93GHz, we can extrapolate that the 2.93GHz X5570 Xeon is spending a lot of time at 3.33GHz – its “turbo” speed – while the power-hungry W5590 spends little time at 3.6GHz. How can we say this? Looking at the tile ratio as a function of the clock speed.
We know that the X5570 can run up to 3.33GHz, per core, according to thermal conditions on the chip. With proper cooling, this could mean up to 100% of the time (sorry, Google). Assuming for a moment that this is the case in the HP test environment (and there is sufficient cause to think so) then the ratio of the tile score to tile count and CPU frequency is 0.433 (24.54/17/3.33). If we examine the same ratio for the W5590, assuming the clock speed of 3.33GHz, we get 0.444 – a difference of 2.5%, or the contribution of “turbo” in the W5590. Likewise, if you back-figure the “apparent speed” of the X5570 using the ratio of the clock-locked W5590, you arrive at 3.25GHz for the W5570 (an 11% gain over base clock). In either case, it is clear that “turbo” is a better value at the low-end of the Nehalem spectrum as there isn’t enough thermal headroom for it to work well for the W-series.
VMmark Equals Meager Network Use
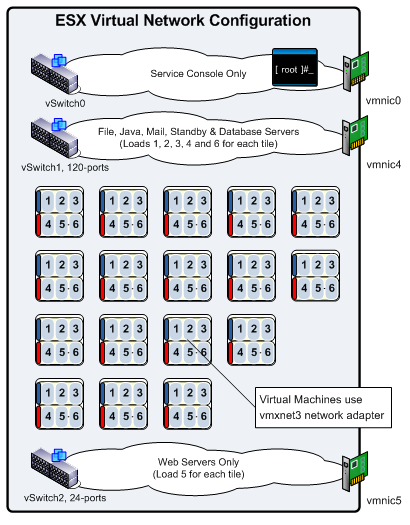
Second, we’re not seeing “fancy” networking tricks out of VMmark submissions. In the past, we’ve commented on the use of “consumer grade” switches in VMmark tests. For this reason, we can consider VMmark’s I/O dependency as related almost exclusively to storage. With respect to networking, the Fujitsu team simply interfaced three 1Gbps network adapter ports to the internal switch of the blade enclosure used to run the client-side load suite and ran with the test. Here’s what that looks like:
Note that the network interfaces used for the VMmark trial are not from the on-board i82575EB network controller but from the PCI-Express quad-port adapter using its older cousin – the i82571EB. What is key here is that VMmark is tied to network performance issues, and it is more likely that additional network ports might increase the likelihood of IRQ sharing and reduced performance more so than the “optimization” of network flows.
Keeping Storage “Simple”
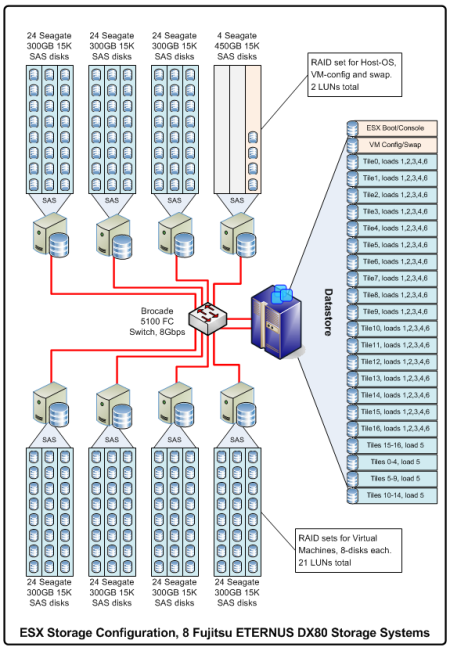
Third, Fujitsu’s approach to storage is elegantly simple: several “inexpensive” arrays with intelligent LUN allocation. For this, Fujistu employed eight of its ETERNUS DX80 Disk Storage Systems with 7 additional storage shelves for a total of 172 working disks and 23 LUNs. For simplicity, Fujistu used a pair of 8Gbps FC ports to feed ESX and at least one port per DX80 – all connected through a Brocade 5100 fabric switch. The result looked something like this:
And yes, the ESX server is configured to boot from SAN, using no locally attached storage. Note that the virtual machine configuration files, VM swap and ESX boot/swap are contained in a separate DX80 system. This “non-default” approach allows the working VMDKs of the virtual machines to be isolated – from a storage perspective – from the swap file overhead, about 5GB per tile. Again, this is a benchmark scenario, not an enterprise deployment, so trade-offs are in favour of performance, not CAPEX or OPEX.
Even if the DX80 solution falls into the $1K/TB range, to say that this approach to storage is “economic” requires a deeper look. At 33 rack units for the solution – including the FC switch but not including the blade chassis – this configuration has a hefty datacenter footprint. In contrast to the old-school server/blade approach, 1 rack at 3 servers per U is a huge savings over the 2 racks of blades or 3 racks of 1U rack servers. Had each of those servers of blades had a mirror pair, we’d be talking about 200+ disks spinning in those racks versus the 172 disks in the ETERNUS arrays, so that still represents a savings of 15.7% in storage-related power/space.
When will storage catch up?
Compared to a 98% reduction in network ports, a 30-80% reduction server/storage CAPEX (based on $1K/TB SAN), a 50-75% reduction in overall datacenter footprint, why is a 15% reduction in datacenter storage footprint acceptable? After all, storage – in the Fujitsu VMmark case – now represents 94% of the datacenter footprint. Even if the load were less aggressively spread across five ESX servers (a conservative 20:1 loading), the amount of space taken by storage only falls to 75%.
How can storage catch up to virtualization densities. First, with 2.5″ SAS drives, a bank of 172 disks can be made to occupy only 16U with very strong performance. This drops storage to only 60% of the datacenter footprint – 10U for hypervisor, 16U for storage, 26U total for this example. Moving from 3.5″ drives to 2.5″ drives takes care of the physical scaling issue with acceptable returns, but results in only minimal gains in terms of power savings.
Saving power in storage platforms is not going to be achieved by simply shrinking disk drives – shrinking the NUMBER of disks required per “effective” LUN is what’s necessary to overcome the power demands of modern, high-performance storage. This is where non-traditional technology like FLASH/SSD is being applied to improve performance while utilizing fewer disks and proportionately less power. For example, instead of dedicating disks on a per LUN basis, carving LUNs out of disk pools accelerated by FLASH (a hybrid storage pool) can result in a 30-40% reduction in disk count – when applied properly – and that means 30-40% reduction in datacenter space and power utilization.
Lessons Learned
Here are our “take aways” from the Fujitsu VMmark case:
1) Top-bin performance is at the losing end of diminishing returns. Unless your budget can accommodate this fact, purchasing decisions about virtualization compute platforms need to be aligned with $/VM within an acceptable performance envelope. When shopping CPU, make sure the top-bin’s “little brother” has the same architecture and feature set and go with the unit priced for the mainstream. (Don’t forget to factor memory density into the equation…) Regardless, try to stick within a $190-280/VM equipment budget for your hypervisor hardware and shoot for a 20-to-1 consolidation ratio (that’s at least $3,800-5,600 per server/blade).
2) While networking is not important to VMmark, this is likely not the case for most enterprise applications. Therefore, VMmark is not a good comparison case for your network-heavy applications. Also, adding more network ports increases capacity and redundancy but does so at the risk of IRQ-sharing (ESX, not ESXi) problems, not to mention the additional cost/number of network switching ports. This is where we think 10GE will significantly change the equation in 2010. Remember to add up the total number of in use ports – including out-of-band management – when factoring in switch density. For net new instalments, look for a switch that provides 10GE/SR or 10GE/CX4 options and go with !0GE/SR if power savings are driving your solution.
3) Storage should be simple, easy to manage, cheap (relatively speaking), dense and low-power. To meet these goals, look for storage technologies that utilize FLASH memory, tiered spindle types, smart block caching and other approaches to limit spindle count without sacrificing performance. Remember to factor in at least the cost of DAS when approximating your storage budget – about $150/VM in simple consolidation cases and $750/VM for more mission critical applications (that’s a range of $9,000-45,000 for a 3-server virtualization stack). The economies in managed storage come chiefly from the administration of the storage, but try to identify storage solutions that reduce datacenter footprint including both rack space and power consumption. Here’s where offerings from Sun and NexentaStor are showing real gains.
We’d like to see VMware update VMmark to include system power specifications so we can better gage – from the sidelines – what solution stack(s) perform according to our needs. VMmark served its purpose by giving the community a standard from which different platforms could be compared in terms of the resultant performance. With the world’s eyes on power consumption and the ecological impact of datacenter choices, adding a “power utilization component” to the “server-side” of the VMmark test would not be that significant of a “tweak.” Here’s how we think it can be done:
- Require power consumption of the server/VMmark related components be recorded, including:
- the ESX platform (rack server, blade & blade chassis, etc.)
- the storage platform providing ESX and test LUN(s) (all heads, shelves, switches, etc.)
- the switching fabric (i.e. Ethernet, 10GE, FC, etc.)
- Power delivered to the test harness platforms, client load machines, etc. can be ignored;
- Power measurements should be recorded at the following times:
- All equipment off (validation check);
- Start-up;
- Single tile load;
- 100% tile capacity;
- 75% tile capacity;
- 50% tile capacity;
- Power measurements should be recorded using a time-power data-logger with readings recorded as 5-minute averages;
- Notations should be made concerning “cache warm-up” intervals, if applicable, where “cache optimized” storage is used.
Why is this important? In the wake of the VCE announcement, solution stacks like VCE need to be measured against each other in an easy to “consume” way. Is VCE the best platform versus a component solution provided by your local VMware integrator? Given that the differentiated VCE components are chiefly UCS, Cisco switching and EMC storage, it will be helpful to have a testing platform that can better differentiate “packaged solutions” instead of uncorrelated vendor “propaganda.”
Let us know what your thoughts are on the subject, either on Twitter or on our blog…


